这是一个好用的工具,跟UML一样能起到很好的作用.
官方网站Graphviz
其官网在介绍Dot language时也用了文法推导.
Layout Engines
使用这些引擎可以得到不同的图
dot
Makes “hierarchical” or layered drawings of directed graphs.
dotis the default tool to use if edges have directionality.
dot是使用有向图的默认工具.
The layout algorithm aims edges in the same direction (top to bottom, or left to right) and then attempts to avoid edge crossings and reduce edge length.
使箭头尽量从上到下,从左到右.其输出格式包括PostScript,PDF,SVG,PNG,含注解的文本等等。
neato
neatois the default tool to use if the graph is not too large (about 100 nodes) and you don’t know anything else about it.
neatoattempts to minimize a global energy function, which is equivalent to statistical multi-dimensional scaling.
放射状,节点不能过多.
twopi
Nodes are placed on concentric circles depending their distance from a given root node.
同心圆
circo
This is suitable for certain diagrams of multiple cyclic structures, such as certain telecommunications networks
圆形图形
fdp
“spring model” layouts similar to those of neato, but does this by reducing forces rather than working with energy.
fdpimplements the Fruchterman-Reingold heuristic including a multigrid solver that handles larger graphs and clustered undirected graphs.
用于生成无向图的工具
此外还有osage,patchwork和sfdp
osagedraws clustered graphs
patchworkdraws clustered graphs using a squarified treemap layoutMultiscale version of
fdpfor the layout of large graphs.
可以输出的类型也非常多,除了常见的图片类型png,jpg,ico,webp还有svg,ps(postscript)/pdf
Dot语言
描述图的生成.
另外还有节点颜色形状,边的颜色箭头样式, 图的颜色等设置,这些直接翻阅官方文档即可.
可以直接写一个dot文件然后命令行输出得到图,也可以配合一些编辑器,例如vscode,下载插件plantUML或者直接Graphviz就有扩展.
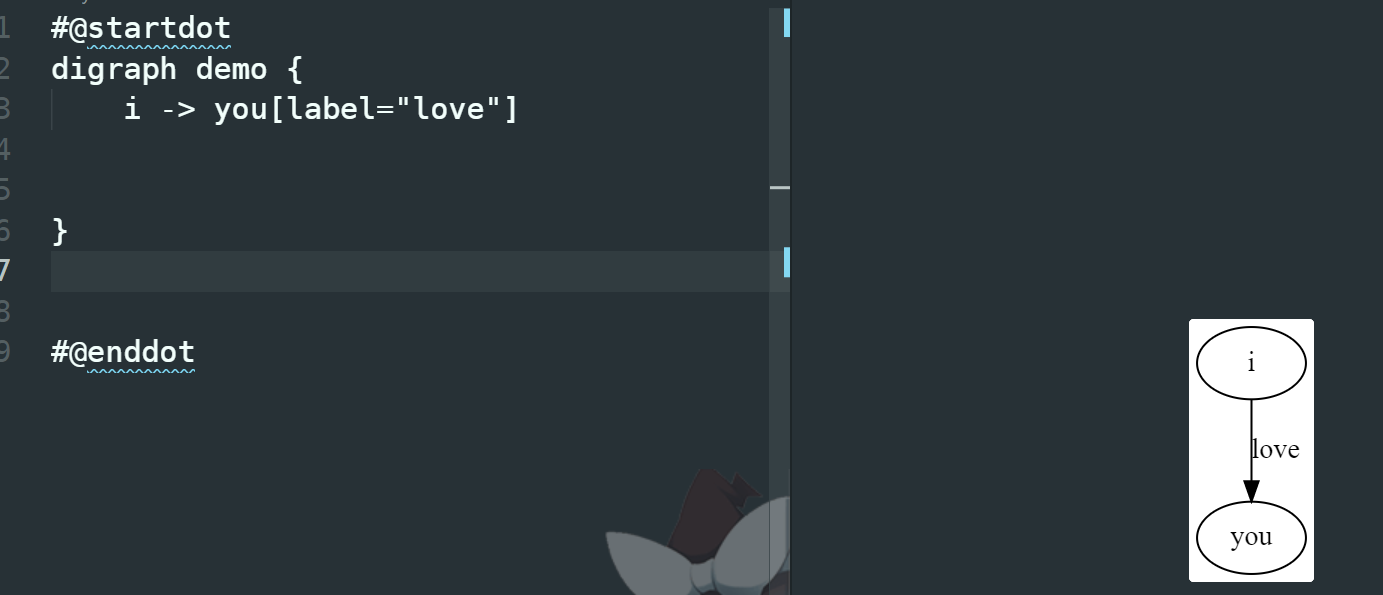
我基本上就在vscode上练了.1
2
3
4
5
6
7
8
9
10
11
12
13
digraph demo {
   label = "示例"
   bgcolor = "beige"
   node[color = "grey"]
    father[label = "爸爸",shape = "box"]
    node[color="#FF6347"]
    strangers[label="路人"]
    edge[color="yellow"]
    father->mother[dir=both,label="爱人"]
    strangers->mother[label="??"]

}
这里说一下问题,vscode插件导出图片后中文变乱码了,预览的时候好好的.
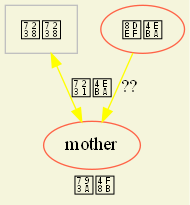
然后我发现这不只是插件的问题,事实上在windows上使用graphviz中文就是会乱码,所以需要额外的设置(不用中文也不是不行),在mac上我记得是不会乱码的.
可行的解决方法是手动添加字体属性,要给node,edge和graph都添加上1
2
3
4
5
6
7
8
9
10
11
12
13
 digraph demo {
   graph[label="图",fontname="FangSong"]
   bgcolor = "beige"
   node[color = "grey",fontname="FangSong"]
    edge[color="yellow",fontname="FangSong"]
    father[label = " 爸爸 ",shape = "box"]
    strangers[label=" 路人 "]

    father->mother[dir=both,label=" 爱人 "]
    strangers->mother[label="??"]
    me[shape="record",label=" |你好| "]
}
然后就正常了.后面如果有解决方法我再更新.
题外话
这里再介绍一下其他的一堆东西.原因是我发现我装的graphviz是msys2中的.
clang和llvm,cygwin,msys2,minGW,msvc.
在windows下clang指令只是负责编译的前端工作,即识别编译指令,与提供报错提示。并不负责具体的代码编译工作,所以在windows下光安装llvm是不够的,还需要有实际的编译链接库,例如安装MinGW或者MSVC来获取需要的运行库
其实clang的含义有一定的歧义,一般可以认为其包含llvm作为后端,下载时直接下载llvm包含clang,苹果一般是自带clang的.狭义理解clang就是前端负责词法语法和语义生成中间代码.
Cygwin是一个可原生运行于Windows系统上的POSIX兼容环境。这意味着我们我可以在windows上使用经典的一些linux东西,比如GNU套装.
MinGW,Minimalist GNU for Windows,用于开发原生(32位) Windows 应用的开发环境。它主要提供了针对 win32 应用的 GCC、GNU binutils 等工具,以及对等于 Windows SDK(的子集)的头文件和用于 MinGW 版本 linker 的库文件(so、a等,而不是 VC 的 lib)。
MinGW 能够替代 cl 用于编译不包含 MFC 的、以 WinSDK 为主的 Windows 应用,并且编译出来的应用不依赖于第三方的模拟层支持,其运行时为大部分 Windows 标配的 msvcrt(故称原生 Windows 应用)。除此之外,MinGW 也支持 GCC 支持的其他语言。
而msys2是msys的升级版,msys是MinGW的分支,作用类似.
区别(小结):Cygwin是模拟 POSIX 系统,源码移植 Linux 应用到 Windows 下;MinGW 是用于开发 Windows 应用的开发环境.
MSVC,就是微软(MS)的VC运行库。VC运行库,是Visual C++的运行库。很多程序在编制的时候,使用了微软的运行库,大大减少了软件的编码量,却提高了兼容性。但运行的时候,需要这些运行库。这些运行库简称就是MSVC。
一些重点
事实上这些东西较难也没有必要完全记住,把官方文档保存,掌握基本要点就行了.
掌握四个重点,图,子图,节点与边.
Graph
| 属性名 | 默认值 | 说明 |
|---|---|---|
| label | 图片标签,如上面示例 | |
| bgcolor | 背景颜色,颜色文档点此 | |
| fontcolor | black | 字体颜色,定义上面示例的颜色 |
| fontname | Times-Roman | 字体 |
| fontsize | 14 | 字体大小 |
| rank | 子图等级限制, same,min,max,source,sink | |
| rankdir | TB | 排序方向,LR(left to right) or TB(top to bottom) |
| compound | false | If true, allow edges between clusters. 配合 lhead 和 ltail 使用 |
label设置图的标题.
graph[设置全局图属性] 注意这种设置会被局部的覆盖,对于图来说倒不是很要紧
如果中文字图出现乱码可以设置fontname.一般rankdir和compound用的较多,可以设置排序方向和边的连接.
注意,有向边只能在有向图中使用,无向边只能在无向图中使用
Node
| 属性名 | 默认值 | 说明 |
|---|---|---|
| label | node name | 节点显示内容 |
| color | black | node边框颜色 |
| fontcolor | black | 字体颜色 |
| fillcolor | 背景色 | |
| fontname | Times-Roman | 字体 |
| fontsize | 14 | 字体大小 |
| shape | ellipse | 形状,box、ellipse、circle、diamond、plaintext、point、triangle、invtriangle |
| style | 图形样式,eg. bold、dashed、dotted、filled | |
| image | 背景图片地址 |
style设置节点样式(主要针对节点的边框的样式),shape设置节点形状.color设置边框颜色.
将节点shape设置为record,用 | 隔开的串会在绘制出来的节点中展现为一条分隔符,用 <> 括起来的串称为锚点
记录形式的节点也可以是竖形排列的。与横向排列的记录的不同只是label的形式不同,label中内容使用 {} 包围则是竖形排列的
Edge
| 属性名 | 默认值 | 说明 |
|---|---|---|
| label | 描述关系 | |
| color | black | 箭头颜色 |
| fontcolor | black | 关系文字颜色 |
| dir | forward | 设置方向:forward,back,both,none |
| arrowhead | normal | 箭头头部形状。box、crow、diamond、dot、none、normal、vee。箭头文档点此 |
| arrowtail | 箭头尾部形状 | |
| arrowsize | 1.0 | 箭头大小 |
| style | 图形样式,eg. bold、dashed、dotted、filled | |
| lhead | 当 compound 为true时,lhead用于指定边指向的cluster | |
| ltail | 与ltail类似 |
设置边的属性,dir可以设置双向
子图
很多属性与图类似
子图名字要以cluster开头
边直接指向cluster,需要设置 compound 为true,并配合 lhead 或 ltail 来实现.
注意
全局生命的属性(例如node[…])只对声明语句后才创建的结构起作用.
看一个例子.1
2
3
4
5
6
7
8
9
10
11
12digraph G {
start -> a0;
start -> b0;
a1 -> b3;
node[color="yellow"];
b2 -> a3;
a3 -> a0;
a3 -> end;
b3 -> end;
start [shape=diamond];
end [shape=Msquare];
}
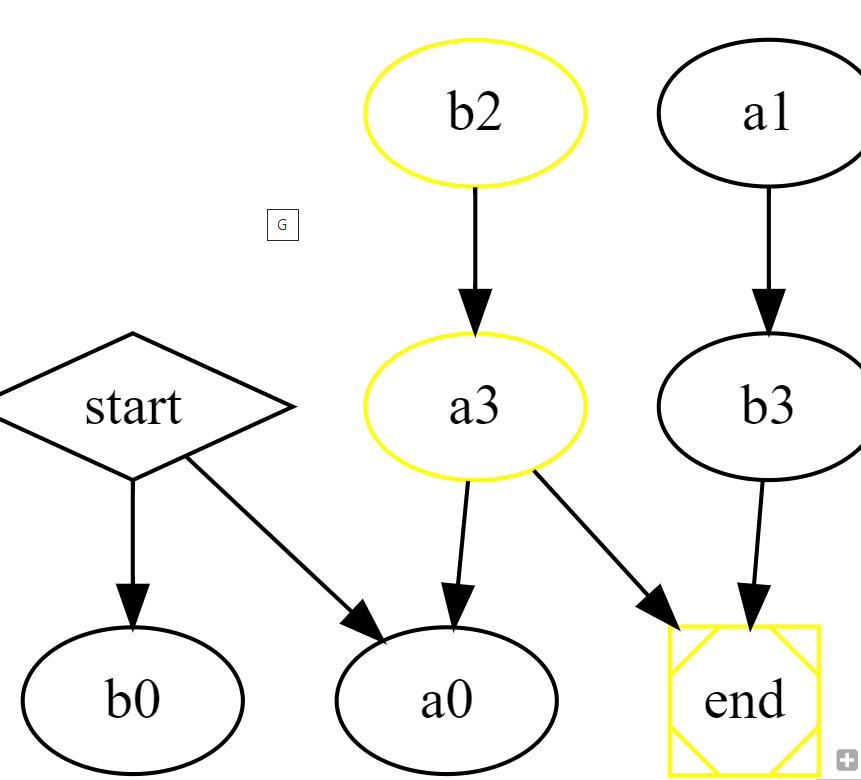
可以看到b2,a3,end节点是黄色,而这三个节点是在声明语句后才创建的.
实战
1 | digraph G { |
首先digraph表示有向图,随后声明两个子图,然后node生命全局属性,然后节点连接.
然后在子图中声明节点属性和图的color属性.
资料
Graphviz 画图的一些总结 - 小胖西瓜 - 博客园 (cnblogs.com)
【VS Code】Windows10下VS Code配置Graphviz和DOT语言环境_memcpy0的博客-CSDN博客介绍了vscode上的几款插件,我建议下载可以直接导出pdf的.